Hawthorne Real Estate Market Report for October 2023
Welcome to the month that was for real estate in Hawthorne CA. The number of homes that sold dropped considerably from the prior month with only 12 homes selling in Hawthorne during October which was a really low number. Compare that to the more typical 22 in September.
According to Hawthorne real estate specialist Keith Kyle, this is the lowest number of sales we’ve seen in over 3 years.
The average “list” price was $965,167 with the average sold price at $940,687 meaning that the homes that sold generally sold below the list price. We also saw a number of price reductions..
The average price per foot was $657 with the average days on market 32 which was slightly below the 34 in the prior two months.
Search the current homes for sale in Hawthorne
October 2023 Hawthorne Home Sales – 12 Sold Homes
View the current homes for sale in Hawthorne CA
| Home Type | Address | Price | $ Per Foot | Bed/Bath | Sq Feet | Age | |
| SFR/D | 4832 W | 135th ST | $935,000 | $914 | 3/2,0,0,0 | 1023/A | 1947/ASR |
| SFR/D | 5037 W | 137th PL | $1,115,000 | $893 | 3/2,0,0,0 | 1249/A | 1954/ASR |
| SFR/A | 5110 W | 132nd St | $1,150,000 | $653 | 3/2,0,0,0 | 1760/AP | 1947/ASR |
| SFR/D | 5303 W | 141st ST | $1,475,000 | $892 | 4/2,0,0,0 | 1654/A | 1959/ASR |
| SFR/D | 11503 S | Van Ness AVE S | $765,000 | $642 | 3/2,0,0,0 | 1192/A | 1954/PUB |
| SFR | 4687 W | 138th ST | $1,130,000 | $525 | 3/2,1,0,0 | 2151/ | 1963/ASR |
| SFR | 11620 | Ardath AVE | $760,000 | $638 | 3/1,1,0,0 | 1192/ | 1954 |
| SFR | 11950 S | Van Ness AVE | $786,248 | $660 | 3/2,0,0,0 | 1192/ | 1954 |
| SFR/D | 3639 W | 145th ST | $860,000 | $688 | 3/1,0,0,0 | 1250/A | 1951/ASR |
| SFR/D | 13325 | Jefferson Avenue | $600,000 | $532 | 3/1,1,1,0 | 1128/A | 1951/ASR |
| SFR/D | 2319 W | 117th ST | $612,000 | $423 | 3/1,1,0,0 | 1447/A | 1954/ASR |
| TPLX/A | 4430 W | 141st ST | $1,100,000 | $430 | 6/4,0,0,0 | 2556/A | 1962/ASR |
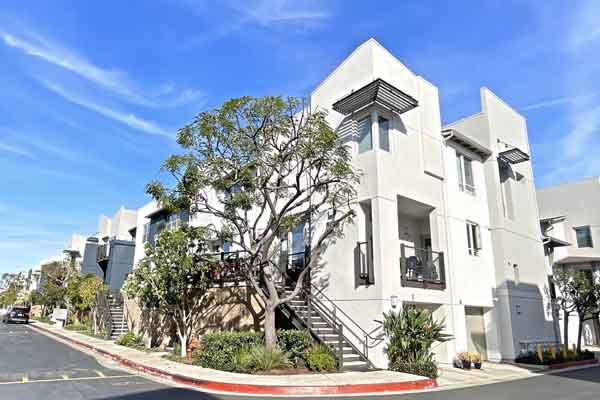
 historically slow. Up until a few weeks ago there hadn’t been a listing for months. Currently there are three homes for sale and they range from the smallest layouts to one of the largest 3 bedroom layouts. Today we wanted to bring to your attention the newest listing to hit the market.