See the Homes that Sold Hawthorne during March 2022
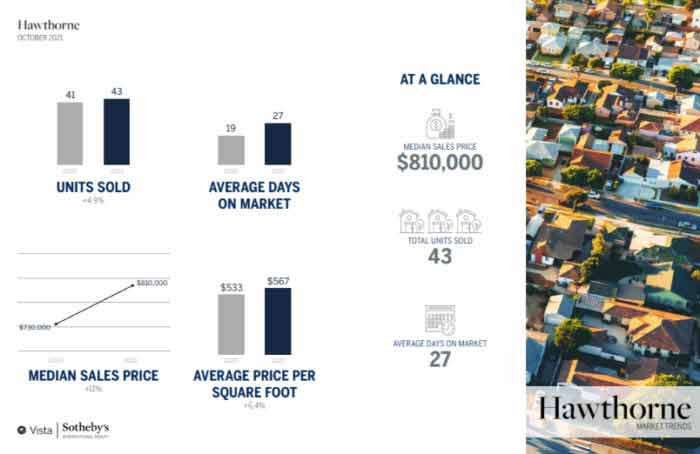
It was a busy month for closed home sales in Hawthorne with 31 closed sales compared with only 24 in February and 15 on MLS homes closing escrow during January. The average “list” price was $864,481 with the average sold price at $918,987 meaning that, in general, homes sold well higher than the list price. The average price per foot was $662 and median days on market was a brief 18. See how that compares with other months on our Hawthorne real estate market trends and statistics page.
Search the current homes for sale in Hawthorne
March 2022 Home Sales and Home Prices in Hawthorne CA
| Type | Address | Price | $ Per Sq Foot | Bed/Bath | Sq Feet | Year Built | |
| SFR/D | 4871 | W 132nd St | $765,000 | $745 | 3/2,0,0,0 | 1027/P | 1947/PUB |
| SFR/D | 12502 | Felton AVE | $835,000 | $566 | 3/1,0,0,0 | 1476/O | 1944/ASR |
| SFR/D | 5512 W | 119th PL | $875,000 | $868 | 3/1,0,0,0 | 1008/A | 1940/ASR |
| SFR/D | 4915 W | 139th ST | $885,000 | $598 | 3/2,0,0,0 | 1480/A | 1951/ASR |
| TWNHS/A | 5402 W | 149th PL #17 | $889,610 | $668 | 2/2,0,0,0 | 1331/S | 2007/ASR |
| CONDO/A | 13024 | Union AVE #201 | $1,040,000 | $728 | 2/2,0,0,0 | 1429/B | 2010/PUB |
| SFR/D | 4919 W | 139th ST | $1,200,000 | $747 | 4/2,0,0,0 | 1607/A | 1951/ASR |
| SFR/D | 5509 W | 122nd ST | $1,200,000 | $881 | 3/2,0,0,0 | 1362/A | 1950/APP |
| SFR | 5126 W | 141ST ST | $1,235,000 | $633 | 3/2,0,0,0 | 1950/ | 1951 |
| SFR/D | 5574 | Palm | $1,325,000 | $712 | 3/1,1,1,0 | 1861/B | 2013/BLD |
| SFR/D | 5346 W | 121st ST | $1,325,000 | $783 | 3/2,0,0,0 | 1692/A | 1949/ASR |
| SFR | 5519 W | 123RD PL | $1,386,000 | $1,224 | 3/2,0,0,0 | 1132/ | 1950 |
| TWNHS | 14439 | CHADRON AVE #16 | $560,000 | $478 | 3/1,0,1,0 | 1171/ | 1985 |
| SFR/D | 11448 | Freeman AVE | $585,000 | $592 | 3/1,0,0,0 | 988/A | 1926/ASR |
| SFR/D | 12239 | Cedar ave | $835,500 | $413 | 4/2,0,0,0 | 2021/A | 1926/ASR |
| SFR/D | 2137 W | 115th ST | $925,000 | $475 | 4/2,0,0,0 | 1946/A | 1954/ASR |
| SFR/D | 4827 W | 121st ST | $1,285,000 | $721 | 3/2,1,0,0 | 1782/A | 1947/ASR |
| SFR/D | 4493 W | 138th ST | $798,725 | $787 | 2/1,1,0,0 | 1015/P | 1942/PUB |
| SFR/D | 4702 W | 132nd ST | $850,000 | $668 | 3/1,0,0,0 | 1272/A | 1952/ASR |
| SFR/D | 5127 W | 141st ST | $1,040,000 | $756 | 3/2,0,0,0 | 1376/A | 1963/PUB |
| SFR/D | 4570 W | 141st ST | $1,165,000 | $743 | 3/1,1,0,0 | 1567/A | 1950/ASR |
| CONDO | 14020 | Cerise AVE | $585,000 | $356 | 3/3,0,0,0 | 1643/ | 1980 |
| CONDO/D | 3704 W | 119th ST | $625,000 | $564 | 3/2,0,1,0 | 1109/A | 1993/PUB |
| SFR/D | 13606 | Lemoli AVE | $711,000 | $468 | 3/2,0,0,0 | 1519/A | 1955/ASR |
| SFR/D | 11619 | Tarron AVE | $747,000 | $590 | 3/2,0,0,0 | 1267/A | 1954/ASR |
| CONDO | 14514 | Yukon AVE | $740,000 | $426 | 3/3,0,0,0 | 1737/ | 1981 |
| SFR | 3618 W | 144TH PL | $1,000,000 | $710 | 3/2,0,0,0 | 1408/ | 1951 |
| SFR/D | 3231 W | 134th PL | $600,000 | $647 | 3/1,0,0,0 | 928/A | 1940/PUB |
| CONDO/A | 14041 | Lemoli AVE | $672,000 | $416 | 3/2,0,1,0 | 1615/A | 1990/ASR |
| SFR/D | 3217 W | 134th ST | $780,000 | $859 | 3/2,0,0,0 | 908/A | 1940/ASR |
| CONDO/A | 5405 W | 149th PL #12 | $1,023,750 | $726 | 3/2,0,0,0 | 1410/P | 2007/PUB |
 Three Sixty South Bay as well as Fusion South Bay. The average list price was $1,015,703 and the average sold price was $1,057,108 meaning that homes sold well over their asking prices. The average price per foot was an impressive $720 and homes averaged only 14 days on market before going into escrow.